Multimodal Analyses Laboratory
The Multimodal Analyses Laboratory (LAM) is equippped with new generation instruments like SEM, Micro-Raman,FTIR and XRD.
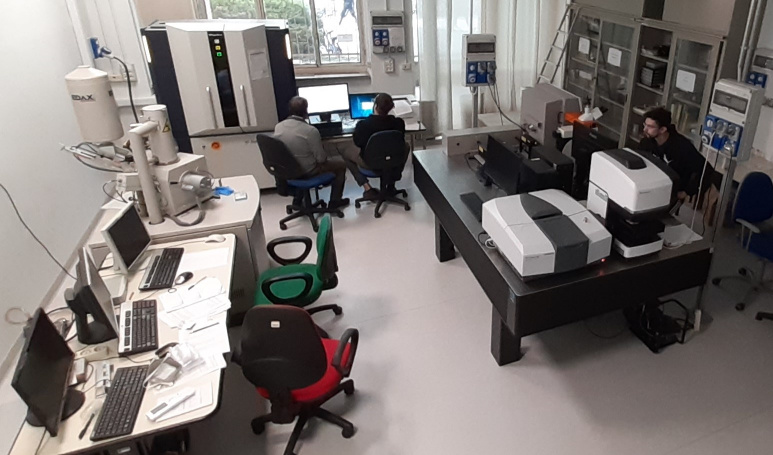 Multimodal Analysis Laboratory (LAM) in activity
X-Ray diffractometry
The X-ray diffraction is the ideal analysis method to obtain informations about crystalline materials structures with anatomic scale and, as in our case, in minerals and rocks. In particular, the powder diffraction allows to perform qualitative and quantitative analysis of the mineralogical composition of the material investigated.
From the diffractogram obtained we can acquire the following informations:
- from the peak position we obtain:
- interplanar distances (Bragg's equation) -> crystallographic cell;
- phase determination -> qualitative analysis;
- from peaks intensity:
- intensity of a phase (structure factor) -> structural analysis (method Ritveld)
- intensity of more phases -> quantitative analysis (with/without standard)
- from peaks width:
- crystallites size;
- crystallites deformation.
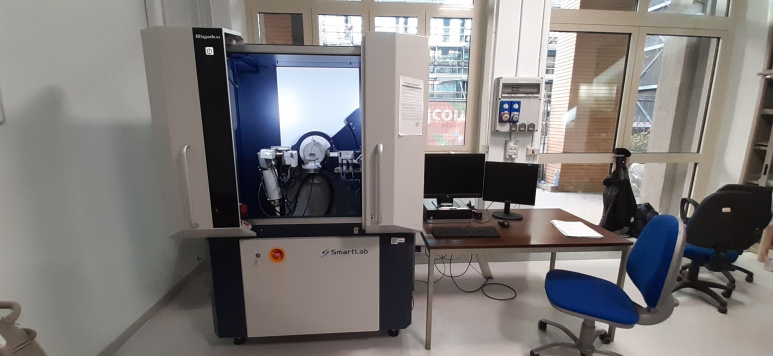 Rigaku SmartLab SE. Diff ractometer
The laboratory is equipped with a recently manufactured Rigaku SmartLab SE and SmarLab Studio II software for theanalysis of the obtained spectra. The latter has the license to use the PDF-4 database, issued by ICDD, useful forqualitative and quantitative analyzes.
Raman Spectroscopy
Raman spectroscopy is an analysis technique that exploits the diffusion of a monochromatic electromagnetic radiation by the analyzed sample. This type of analysis is widely used in the study of solid state materials (e.g. rocks, minerals, polymers) and liquid, it is a non-destructive, fast and easily achievable technique without particular sample preparation.
During the analysis the sample is hit by an electromagnetic radiation from a laser source, which interacting with the electrons of the molecules induces on them an electric dipole responsible for the diffusion process of the incident radiation. This phenomenon is represented through a spectrum that provides information on the structure of molecular vibrational energy levels. By comparing the experimental spectrum with a database it is possible to uniquely identify the nature of the material analyzed.
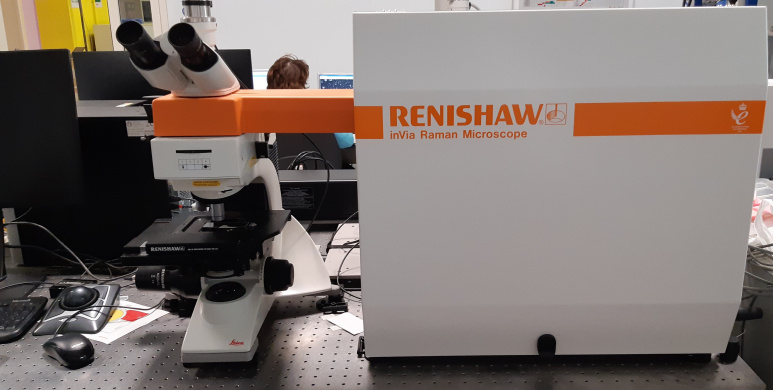 Confocal Renishaw microscope
The laboratory is also equipped with an inVia™ confocal Raman microscope produced by Renishaw, with optics with 5x,20x and 50x magnification that allow an effective analysis of samples of geological or artificial origin. Furthermore, the microscope can be used with reflected and transmitted light, useful for the observation and point analysis of thin sections.
Scanning Electron microscopy and EDX spectroscopy (SEM-EDX)
The electron microscope is a type of microscope that uses an electron beam as a radiation source, unlike the optical microscope that uses light. The electron beam having a very small length allows the electron microscope to reach avery high resolution.
In the scanning electron microscope, the electron beam strikes the sample from which numerous particles areemitted, including secondary electrons; the latter are detected and converted into an electrical impulse.
SEM is usually equipped with a probe to perform EDX (Energy Dispersive X-ray) spectroscopy analysis. EDX analysis isa non-destructive methodology that allows you to analyze solid conductive samples and obtain an elementary analysis, which allows you to detect the presence of elements even in small traces.
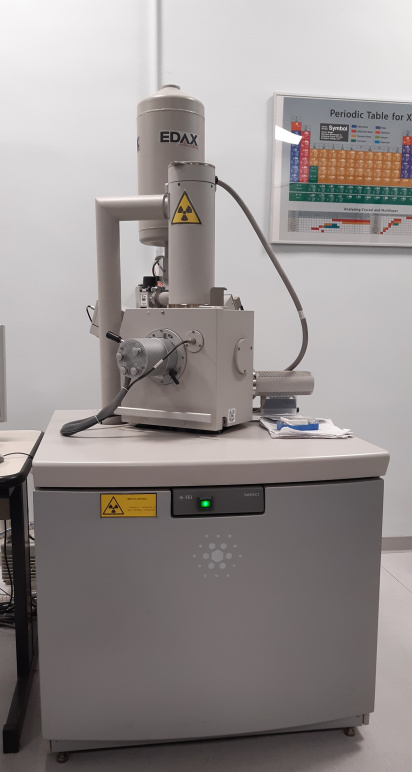 SEM FEI Company Inspect S
Fourier Transform Infrared Spectroscopy (FTIR)
Infrared spectroscopy or IR spectroscopy is an absorption spectroscopic technique normally used for the characterization of materials. When an infrared photon is absorbed by a molecule, it passes from its fundamental vibrational state to an excited vibrational state. In a typical infrared absciss a spectrum a scale of frequencies expressed in wave number and in ordinate the percentage of transmittance is indicated.
Fourier transform IR spectroscopy, or in abbreviated FT-IR form, is performed using an interferometer which allowsthe scanning of all the frequencies present in the IR radiation generated by the source. Scanning is possible thanks toa moving mirror which, by moving, introduces a diff erence in optical path, which gives rise to a constructive ordestructive interference with the ray refl ected by a fi xed mirror. Sia thus obtains an interferogram showing therepresentation of intensity in the time domain. By applying the Fourier transform a computer allows to obtain theinfrared spectrum, that is the representation of the intensity in the frequency domain.
The FT-IR spectroscopy guarantees high performance thanks to a signifi cantly better signal-to-noise ratio than infrared microscopy, moreover the analysis times are very short.
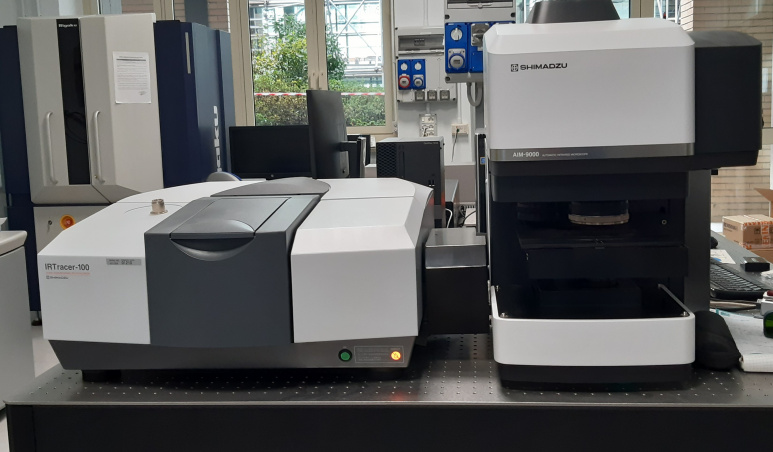 FT-IR Microscopy Shimadzu AIM-9000
Finally, the laboratory is equipped with a Shimadzu AIM-9000 microscope provided with a Shimadzu IRTracer-100 spectrophotometer.